Agricultural Complex
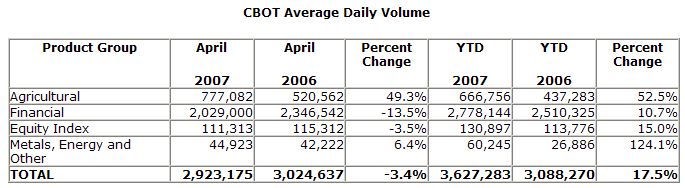
April’s ADV in the CBOT Agricultural complex set a record – 777,082 contracts, 49 percent greater than April 2006. Increased electronic trading volume contributed to the higher volume totals in the Agricultural complex. In April, 58 percent of total CBOT Agricultural futures trading volume was conducted electronically. April’s electronic ADV for Agricultural futures and options was 383,155 contracts, 43 percent greater than the first quarter of 2007. Year-to-date, Agricultural complex ADV is 666,756 contracts, an increase of 52 percent over the same period in 2006.
April’s Agricultural trading activity was driven by volume increases across many of the individual products within the complex. Corn futures set a monthly record, as an average of 304,771 contracts traded each day in April – an increase of 65 percent compared with April 2006. Wheat futures achieved record ADV in April – 104,126 contracts, and an increase of 52 percent over April 2006. Soybean Oil futures also reached a new record in April, as ADV was 60,917 contracts, up 34 percent compared with April 2006.
In addition, Corn options on futures (101 percent), Soybean futures (31 percent), Soybean options on futures (6 percent), Soybean Meal futures (10 percent), and Wheat options on futures (120 percent) all experienced notable ADV growth in April, compared with the same month a year earlier.
Interest Rate Complex
April’s ADV in the CBOT Interest Rate complex was 2,029,000 contracts, a decline of 14 percent compared with April 2006. Year-to-date, ADV in the CBOT Interest Rate complex is 2,778,144 contracts, an increase of 11 percent compared with the same period in 2006.
The Exchange’s 2-year U.S. Treasury Note futures contracts experienced an increase in April as ADV reached 148,966 contracts, up 35 percent over April 2006. Other CBOT Treasury complex products saw a drop in ADV: 30-year U.S. Treasury Bond futures (21 percent), 10-year U.S. Treasury Note futures (3 percent), 5-year U.S. Treasury Note futures (4 percent) and 30-day Federal Fund futures (48 percent) all experienced ADV declines when comparing April 2007 with the same month in 2006.
Trading volume of financial options contracts declined in April, as ADV was 266,146 contracts – down 43 percent compared with April 2006. But the Exchange’s newest electronically-traded financial options contracts, its Binary options on the Target Federal Funds Rate, saw ADV grow by 51 percent compared with March 2007.
ADV in the CBOT Interest Rate Swap complex was 1,643 contracts in April, an increase of 1,015 contracts compared with April 2006. Both the 5-year and 10-year Swap contracts experienced volume growth for April, increasing 360 percent and 98 percent, respectively, over the same month last year.
Metals Complex
ADV in the CBOT Metals complex was 44,495 contracts in April, an increase of 6 percent compared with April 2006. Full-sized (100 Oz.) Gold futures saw ADV reach 30,683 contracts in April, up 32 percent over the same period in 2006. Full-sized (5,000 Oz.) Silver futures ADV was 6,531 contracts in April, an increase of 33 percent compared with April 2006. Year-to-date 2007 in the CBOT metals complex was 60,003 contracts, more than double the ADV from the same period last year.
Equity Index Complex
ADV in the CBOT Equity Index complex was 111,313 contracts in April, a decline of 3 percent compared with April 2006. Year-to-date ADV in the CBOT Equity Index complex was 130,897 contracts, an increase of 15 percent compared with the same period in 2006.
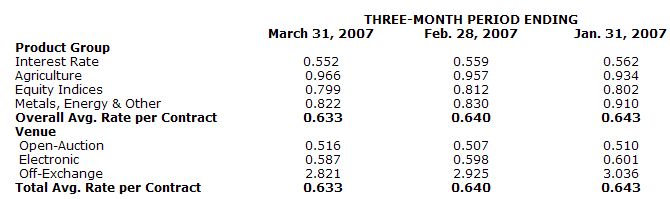
CBOT Rate Per Contract
The following chart depicts the Exchange’s March 2006 three-month rolling average rate per contract (in dollars), and the two preceding three-month periods’ average rates per contract. Average rate per contract represents total exchange and clearing revenue divided by total reported trading volume. Average rates per contract can be affected by exchange and clearing fee price levels, and the customer, product, venue and transaction mix.