Agricultural Complex
ADV in the CBOT Agricultural complex was a record 725,925 contracts in February, 40 percent greater than February 2006. Increased electronic trading volume contributed to the higher volume totals in the Agricultural complex. February’s electronic ADV for Agricultural futures and options was a record 301,785 contracts, up 26 percent compared with January of 2007.
February’s Agricultural trading activity was highlighted by volume increases across many of the individual products within the complex. Corn futures (42 percent), Corn options (93 percent), Soybean futures (39 percent), Soybean options (4 percent), Soybean Meal futures (68 percent), Soybean Oil futures (79 percent), Wheat futures (6 percent) and Wheat options (5 percent) all experienced notable volume growth in February, compared with the same month a year earlier.
Interest Rate Complex
February’s ADV in the CBOT Interest Rate complex was a record 3,621,941 contracts, up 40 percent over February 2006. Overall complex growth was fueled by record volume totals in 2-year U.S. Treasury Note futures, 5-year U.S. Treasury Note futures and 10-year U.S. Treasury Note futures. February 2007 ADV for 2-year Treasury Note futures was 298,240 contracts, ADV for 5-year Treasury Note Futures was 758,431 contracts, and ADV for 10-year Treasury Note futures was 1,598,272 contracts, increases of 76 percent, 19 percent and 43 percent, respectively, compared with February 2006.
Electronic trading volume of financial options contracts also continued to grow in February, as ADV reached 96,225 contracts – up 84 percent over February 2006. The Exchange’s newest electronically-traded financial options contracts, its Binary options on the Target Federal Funds Rate, contributed to this growth, as ADV reached a record 1,411 contracts – more than double the volume from January 2007. And, when comparing February 2007 ADV with ADV from February 2006, 30-year U.S. Treasury Bond options (193 percent), 10-year U.S. Treasury Note options (70 percent) and 5-year U.S. Treasury Note options (44 percent) all experienced electronic ADV increases. In February 2007, 25 percent of all Financial options traded at the CBOT were executed electronically.
ADV in the CBOT Interest Rate Swap complex was 3,662 contracts in February 2007, an increase of 1,886 contracts compared with February 2006. Both the 5-year and 10-year Swap contracts experienced volume growth for February. 5-year Swap volume increased by 81 percent over February 2006, and 10-year Swap volume was 3 times greater than the same month last year.
Metals Complex
ADV in the CBOT Metals complex was 72,403 contracts in February, 3 times greater compared with February 2006. Full-sized (100 Oz.) Gold futures saw ADV reach 52,313 contracts in February, 4 times greater than February 2006, but down less than 2 percent compared with January 2007. ADV in mini-sized (33 Oz.) Gold futures was 7,087 contracts in February, up 37 percent compared with February 2006 and 19 percent greater than January 2007.
The CBOT Silver complex experienced volume growth in February, as Full-sized (5,000 Oz.) Silver futures ADV was 9,650 contracts, 7 times greater than February 2006 and 15 percent greater than January 2007. ADV in mini-sized (1,000 Oz.) Silver futures reached 2,529 contracts during February, an increase of 83 percent compared with February 2006 and up 62 percent compared with January 2007.
Equity Index Complex
ADV in the CBOT Equity Index complex was 117,766 contracts in February, an increase of 10 percent compared with February 2006.
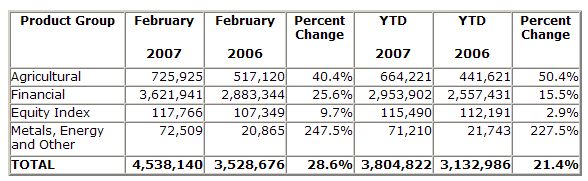
CBOT Average Daily Volume
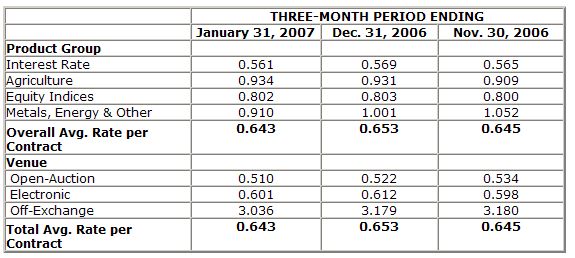
CBOT Rate Per Contract
The following chart depicts the Exchange’s January 2007 three-month rolling average rate per contract (in dollars), and the two preceding three-month periods’ average rates per contract. Average rate per contract represents total exchange and clearing revenue divided by total reported trading volume. Average rates per contract can be affected by exchange and clearing fee price levels, and the customer, product, venue and transaction mix.